- Autoscaler
- Horizontal Pod Autoscaler
- 自动伸缩算法
- 针对CPU的扩缩容实践
- 自定义Metrics(Prometheus)实践
- Spring Boot 2.0通过micrometer提供http_requests_total指标信息
- 参考资料
Autoscaler
在kubernetes中有三种Autoscaler。
- CA(Cluster Autoscaler): 指的是集群级别的自动扩缩容,主要针对Node级别
- HPA(Horizontal Pod Autoscaler): 指的是Pod的个数自动扩缩容
- VPA(Vertical Pod Autoscaler): 指的是Pod的所占用的资源的自动扩缩容,主要指的是CPU, Memory等
本文着重介绍的是HPA。
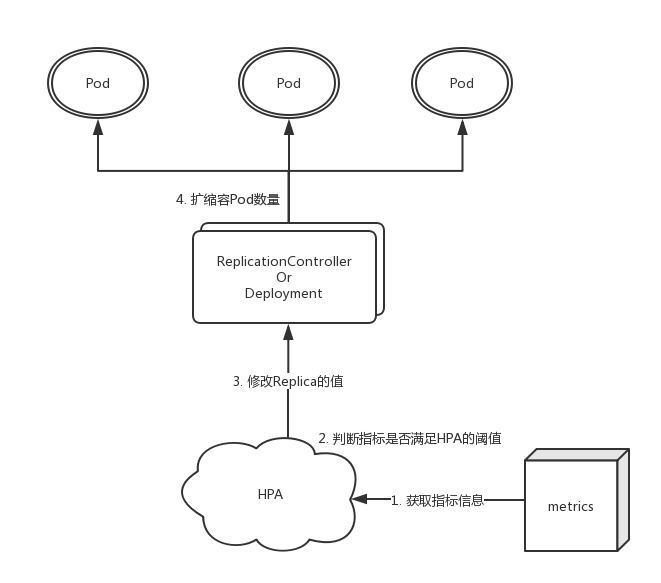
Horizontal Pod Autoscaler
Horizontal Pod Autoscaling可以根据CPU使用率或应用自定义metrics自动扩展Pod数量(支持replication controller、deployment和replica set)。但是需要注意的是HPA不能作用在不能扩展的对象上,比如DaemonSets。
-
支持多种metrics查询方式: Resource Metrics API和Custom Metrics API,其中Resource Metrics API包含Heapster(Deprecated as of Kubernetes 1.11)和Metrics Server两种方式, 再Resource Metrics中
autoscaling/v1只支持CPU,在autoscaling/v2beta2支持CPU, Memory和Custom Metrics; Custom Metrics API有一些第三方的组件,比如Prometheus Adapter, Microsoft Azure Adapter, Datadog Cluster Agent, Google Stackdriver (coming soon)
metrics:
- type: Resource
  resource:
    name: cpu
    target:
      kind: AverageUtilization
      averageUtilization: 50
- type: Pods
  pods:
    metric:
      name: packets-per-second
    targetAverageValue: 1k
- type: Object
  object:
    metric:
      name: requests-per-second
    describedObject:
      apiVersion: extensions/v1beta1
      kind: Ingress
      name: main-route
    target:
      kind: Value
value: 10k- type: External
external:
metric:
name: queue_messages_ready
selector: "queue=worker_tasks"
target:
type: AverageValue
averageValue: 30需要注意的是,从v1.12版本之后,配置方式略有不同,所以再选择集群的时候需要注意。
自动伸缩算法
-
预期Pod数量=ceil[当前Pod数量 * (当前指标采集值/预期指标采集值)]
ceil在此处指向上取整数
-
控制管理器每隔30s(可以通过
--horizontal-pod-autoscaler-sync-period修改)查询metrics的资源使用情况 -
在每一次作出决策后的一段时间内,将不再进行扩缩容。对于扩容而言,这个时间为3分钟(可以通过
--horizontal-pod-autoscaler-upscale-delay修改),但是在v1.12之后这个功能被移除了。缩容为5分钟(可以通过--horizontal-pod-autoscaler-downscale-delay进行调整)。
针对CPU的扩缩容实践
Dockerfile
执行Dockerfile打镜像
- 在Kubernetes的每一台Node上执行如下安装hpa-example镜像
- 或者将镜像上传到自己的Docker repository中,就不用再每个Node上都执行一次docker build了。
[root@k8s-node-3 hpa]# cat Dockerfile
FROM php:5-apache
ADD index.php /var/www/html/index.php
RUN chmod a+rx index.php
[root@k8s-node-3 hpa]# docker build -t hpa-example .
Sending build context to Docker daemon  10.24kB
Step 1/3 : FROM php:5-apache
 ---> 24c791995c1e
Step 2/3 : ADD index.php /var/www/html/index.php
 ---> Using cache
 ---> f19e05490aad
Step 3/3 : RUN chmod a+rx index.php
 ---> Using cache
 ---> a31627478eaf
Successfully built a31627478eaf
Successfully tagged hpa-example:latest
创建Deployment和Service
[root@k8s-node-3 hpa]# kubectl run php-apache --image=hpa-example --image-pull-policy=IfNotPresent --requests=cpu=200m --expose --port=80
service "php-apache" created
deployment "php-apache" created
创建HPA
[root@k8s-node-3 hpa]# kubectl autoscale deployment php-apache --cpu-percent=50 --min=1 --max=10
deployment "php-apache" autoscaled
[root@k8s-node-3 hpa]# kubectl get hpa
NAME         REFERENCE               TARGETS                MINPODS   MAXPODS   REPLICAS   AGE
php-apache   Deployment/php-apache   <unknown> / 50%        1         10        0          25s
增加负载
[root@k8s-node-3 hpa]# kubectl run -i --tty load-generator --image=busybox /bin/sh
If you don't see a command prompt, try pressing enter.
/ # while true; do wget -q -O- http://php-apache.default.svc.cluster.local; done
检测HPA变化
[root@k8s-node-3 hpa]# watch kubectl get hpa
Every 2.0s: kubectl get hpa                                  Thu Jan 24 08:00:07 2019

NAME         REFERENCE               TARGETS                MINPODS   MAXPODS   REPLICAS   AGE
php-apache   Deployment/php-apache   0% / 50%               1         10        1          2h
等待一到两分钟后
Every 2.0s: kubectl get hpa                                  Thu Jan 24 08:02:43 2019

NAME         REFERENCE               TARGETS                MINPODS   MAXPODS   REPLICAS   AGE
php-apache Deployment/php-apache 457% / 50% 1 10 4 2h[root@k8s-node-3 hpa]# kubectl get deployment php-apache
NAME DESIRED CURRENT UP-TO-DATE AVAILABLE AGE
php-apache 4 4 4 4 1h停止负载并等待5分钟后
Every 2.0s: kubectl get hpa Thu Jan 24 08:13:57 2019
NAME REFERENCE TARGETS MINPODS MAXPODS REPLICAS AGE
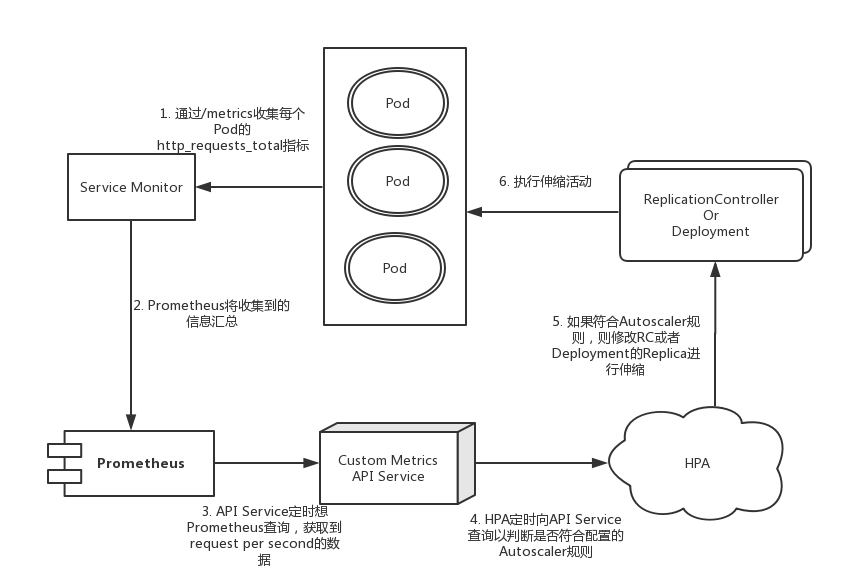
php-apache Deployment/php-apache 0% / 50% 1 10 1 2h自定义Metrics(Prometheus)实践
整体架构设计图如下:
安装Prometheus Operator
如果Kubernetes集群已经安装Prometheus Operator直接忽略跳到下一步。
[root@k8s-node-3 hpa]# git clone https://github.com/luxas/kubeadm-workshop.git
Cloning into 'kubeadm-workshop'...
remote: Enumerating objects: 1114, done.
Receiving objects: 100% (1114/1114), 925.75 KiB | 69.00 KiB/s, done.
remote: Total 1114 (delta 0), reused 0 (delta 0), pack-reused 1114
Resolving deltas: 100% (661/661), done.

[root@k8s-node-3 kubeadm-workshop]# kubectl apply -f demos/monitoring/prometheus-operator.yaml
clusterrole "prometheus-operator" configured
serviceaccount "prometheus-operator" unchanged
clusterrolebinding "prometheus-operator" configured
Error from server (BadRequest): error when creating "demos/monitoring/prometheus-operator.yaml": Deployment in version "v1" cannot be handled as a Deployment: no kind "Deployment" is registered for version "apps/v1"遇到一个问题说kubernetes集群中没有apps/v1的API信息。
查看了下自己的kubernetes版本为v1.8.4, 而kubernetes集群再v1.9.0之后才开始支持apps/v1, 在v1.8.4可以使用apps/v1beta2来替代,或者可以升级集群到v1.9.0之后。
[root@k8s-node-3 kubeadm-workshop]# kubectl version
Client Version: version.Info{Major:"1", Minor:"8", GitVersion:"v1.8.4", GitCommit:"9befc2b8928a9426501d3bf62f72849d5cbcd5a3", GitTreeState:"clean", BuildDate:"2017-11-20T05:28:34Z", GoVersion:"go1.8.3", Compiler:"gc", Platform:"linux/amd64"}
Server Version: version.Info{Major:"1", Minor:"8", GitVersion:"v1.8.4", GitCommit:"9befc2b8928a9426501d3bf62f72849d5cbcd5a3", GitTreeState:"clean", BuildDate:"2017-11-20T05:17:43Z", GoVersion:"go1.8.3", Compiler:"gc", Platform:"linux/amd64"}- 方案一: 在
v1.8.4使用apps/v1beta2来替代
[root@k8s-node-3 hpa]# cd kubeadm-workshop/demos/monitoring
[root@k8s-node-3 monitoring]# find . | xargs grep "apps/v1"
grep: .: Is a directory
./custom-metrics.yaml:apiVersion: apps/v1
./influx-grafana.yaml:apiVersion: apps/v1
./influx-grafana.yaml:apiVersion: apps/v1
./metrics-server.yaml:apiVersion: apps/v1
./prometheus-operator.yaml:apiVersion: apps/v1
./sample-metrics-app.yaml:apiVersion: apps/v1
./sample-metrics-app.yaml:apiVersion: apps/v1
[root@k8s-node-3 monitoring]# sed -i "s#apps/v1#apps/v1beta2#g" `grep apps/v1 -rl .`- 方案二: 升级到
v1.10.0
https://kubernetes.io/docs/tasks/administer-cluster/kubeadm/kubeadm-upgrade-1-11/
我的选择是升级到v1.10.0
安装Prometheus Operator
[root@k8s-node-3 monitoring]# kubectl apply -f prometheus-operator.yaml
clusterrole "prometheus-operator" configured
serviceaccount "prometheus-operator" unchanged
clusterrolebinding "prometheus-operator" configured
deployment "prometheus-operator" created
#等prometheus-operator的pod启动完成
[root@k8s-node-3 monitoring]# kubectl get pod|grep prometheus
prometheus-operator-7464bf9889-p698h   1/1       Running   0          15m
安装Prometheus
[root@k8s-node-3 monitoring]# kubectl apply -f sample-prometheus-instance.yaml
clusterrole.rbac.authorization.k8s.io/prometheus created
serviceaccount/prometheus created
clusterrolebinding.rbac.authorization.k8s.io/prometheus created
prometheus.monitoring.coreos.com/sample-metrics-prom created
service/sample-metrics-prom created
安装Custom Metrics API Service
[root@k8s-node-3 monitoring]# kubectl apply -f demos/monitoring/custom-metrics.yaml
namespace/custom-metrics created
serviceaccount/custom-metrics-apiserver created
clusterrolebinding.rbac.authorization.k8s.io/custom-metrics:system:auth-delegator created
rolebinding.rbac.authorization.k8s.io/custom-metrics-auth-reader created
clusterrole.rbac.authorization.k8s.io/custom-metrics-resource-reader created
clusterrolebinding.rbac.authorization.k8s.io/custom-metrics-apiserver-resource-reader created
clusterrole.rbac.authorization.k8s.io/custom-metrics-getter created
clusterrolebinding.rbac.authorization.k8s.io/hpa-custom-metrics-getter created
deployment.apps/custom-metrics-apiserver created
service/api created
apiservice.apiregistration.k8s.io/v1beta1.custom.metrics.k8s.io created
clusterrole.rbac.authorization.k8s.io/custom-metrics-server-resources created
clusterrolebinding.rbac.authorization.k8s.io/hpa-controller-custom-metrics created
安装Sample Metrics App
[root@k8s-node-3 monitoring]# kubectl apply -f sample-metrics-app.yaml
deployment.apps/sample-metrics-app created
service/sample-metrics-app created
servicemonitor.monitoring.coreos.com/sample-metrics-app created
horizontalpodautoscaler.autoscaling/sample-metrics-app-hpa created
ingress.extensions/sample-metrics-app created
查看HPA状态
[root@k8s-node-3 monitoring]# kubectl get hpa
NAME                     REFERENCE                       TARGETS    MINPODS   MAXPODS   REPLICAS   AGE
sample-metrics-app-hpa   Deployment/sample-metrics-app   866m/100   2         10        2          2m
查看API Service中的指标情况
[root@k8s-node-3 monitoring]# kubectl get --raw "/apis/custom.metrics.k8s.io/v1beta1/namespaces/default/pods/*/http_requests" | jq .
{
  "kind": "MetricValueList",
  "apiVersion": "custom.metrics.k8s.io/v1beta1",
  "metadata": {
    "selfLink": "/apis/custom.metrics.k8s.io/v1beta1/namespaces/default/pods/%2A/http_requests"
  },
  "items": [
    {
      "describedObject": {
        "kind": "Pod",
        "namespace": "default",
        "name": "sample-metrics-app-5f67fcbc57-4swjf",
        "apiVersion": "/__internal"
      },
      "metricName": "http_requests",
      "timestamp": "2019-02-01T06:18:52Z",
      "value": "433m"
    },
    {
      "describedObject": {
        "kind": "Pod",
        "namespace": "default",
        "name": "sample-metrics-app-5f67fcbc57-rrg4p",
        "apiVersion": "/__internal"
      },
      "metricName": "http_requests",
      "timestamp": "2019-02-01T06:18:52Z",
      "value": "433m"
    }
  ]
}
加压
[root@k8s-node-3 monitoring]# docker run -it -v /usr/local/bin:/go/bin golang:1.8 go get github.com/rakyll/hey
[root@k8s-node-3 monitoring]# export APP_ENDPOINT=$(kubectl get svc sample-metrics-app -o template --template ); echo ${APP_ENDPOINT}
[root@k8s-node-3 monitoring]# hey -n 50000 -c 1000 http://${APP_ENDPOINT}
查看 HPA 和 API Service 状态
[root@k8s-node-3 monitoring]# kubectl get hpa
[root@k8s-node-3 monitoring]# kubectl get --raw "/apis/custom.metrics.k8s.io/v1beta1/namespaces/default/pods/*/http_requests" | jq .
Spring Boot 2.0通过micrometer提供http_requests_total指标信息
Pom.xml
<dependency>
    <groupId>io.micrometer</groupId>
    <artifactId>micrometer-registry-prometheus</artifactId>
    <version>1.0.4</version>
    <scope>runtime</scope>
</dependency>
MetricsConfig.java
package com.freud.hpa.config;

import io.micrometer.core.instrument.MeterRegistry;
import io.micrometer.core.instrument.config.MeterFilter;
import org.springframework.beans.factory.annotation.Value;
import org.springframework.boot.actuate.autoconfigure.metrics.MeterRegistryCustomizer;
import org.springframework.context.annotation.Bean;
import org.springframework.context.annotation.Configuration;

import java.time.Duration;

@Configuration
public class MetricsConfig {

    private static final Duration HISTOGRAM_EXPIRY = Duration.ofMinutes(10);

    private static final Duration STEP = Duration.ofSeconds(5);

    @Value("${spring.application.name}")
    private String serviceName;

    @Bean
    public MeterRegistryCustomizer<MeterRegistry> metricsCommonTags() { // (2)
        return registry -> registry.config()
                .commonTags("service", serviceName) // (3)
                .meterFilter(MeterFilter.deny(id -> { // (4)
                    String uri = id.getTag("uri");
                    return uri != null && uri.startsWith("/swagger");
                }));
    }

}
WebConfig.java
package com.freud.hpa.config;

import org.springframework.beans.factory.annotation.Autowired;
import org.springframework.beans.factory.annotation.Value;
import org.springframework.context.annotation.Configuration;
import org.springframework.web.servlet.config.annotation.CorsRegistry;
import org.springframework.web.servlet.config.annotation.EnableWebMvc;
import org.springframework.web.servlet.config.annotation.InterceptorRegistry;
import org.springframework.web.servlet.config.annotation.WebMvcConfigurer;

@Configuration
@EnableWebMvc
public class WebConfig implements WebMvcConfigurer {

  @Autowired
  private RequestCounterInterceptor requestCounterInterceptor;

  @Override
  public void addInterceptors(InterceptorRegistry registry) {
    registry.addInterceptor(requestCounterInterceptor);
  }
}
RequestCounterInterceptor.java
package com.freud.hpa.config;

import java.lang.reflect.Method;

import javax.servlet.http.HttpServletRequest;
import javax.servlet.http.HttpServletResponse;

import org.springframework.beans.factory.annotation.Autowired;
import org.springframework.context.annotation.Configuration;
import org.springframework.web.method.HandlerMethod;
import org.springframework.web.servlet.handler.HandlerInterceptorAdapter;

import io.micrometer.core.instrument.Counter;
import io.micrometer.core.instrument.MeterRegistry;

@Configuration
public class RequestCounterInterceptor extends HandlerInterceptorAdapter {

  private static final String METRICS_HTTP_REQUESTS_TOTAL = "http_requests_total";
  private static final String TAG_METHOD = "method";
  private static final String TAG_HANDLER = "handler";
  private static final String TAG_STATUS = "status";

  @Autowired
  private MeterRegistry registry;

  @Override
  public void afterCompletion(HttpServletRequest request, HttpServletResponse response, Object handler, Exception e)
      throws Exception {

    String handlerLabel = handler.toString();
    // get short form of handler method name
    if (handler instanceof HandlerMethod) {
      Method method = ((HandlerMethod) handler).getMethod();
      handlerLabel = method.getDeclaringClass().getSimpleName() + "." + method.getName();
    }

    Counter http_requests_total = registry.find(METRICS_HTTP_REQUESTS_TOTAL).tag(TAG_METHOD, request.getMethod())
        .tag(TAG_HANDLER, handlerLabel).tag(TAG_STATUS, Integer.toString(response.getStatus())).counter();

    if (http_requests_total == null) {
      synchronized (this) {
        if (http_requests_total == null) {
          http_requests_total = registry.counter(METRICS_HTTP_REQUESTS_TOTAL, TAG_METHOD, request.getMethod(),
              TAG_HANDLER, handlerLabel, TAG_STATUS, Integer.toString(response.getStatus()));
        }
      }
    }

    http_requests_total.increment();
  }
}
参考资料
Kubernetes Autoscaler : https://github.com/kubernetes/autoscaler
Horizontal Pod Autoscaler : https://kubernetes.io/docs/tasks/run-application/horizontal-pod-autoscale/
Autoscaling Deployments with Custom Metrics : https://cloud.google.com/kubernetes-engine/docs/tutorials/custom-metrics-autoscaling
Horizontal pod auto scaling by using custom metrics : https://www.ibm.com/support/knowledgecenter/en/SSBS6K_2.1.0.3/manage_cluster/hpa.html
Kubernetes Autoscaling 101 : Cluster Autoscaler, Horizontal Pod Autoscaler, and Vertical Pod Autoscaler : https://medium.com/magalix/kubernetes-autoscaling-101-cluster-autoscaler-horizontal-pod-autoscaler-and-vertical-pod-2a441d9ad231
Configuring vertical pod autoscaling : https://cloud.google.com/kubernetes-engine/docs/how-to/vertical-pod-autoscaling
Horizontal Pod Autoscaling : https://www.kubernetes.org.cn/horizontal-pod-autoscaling
Upgrading kubeadm clusters from v1.10 to v1.11: https://kubernetes.io/docs/tasks/administer-cluster/kubeadm/kubeadm-upgrade-1-11/
kubeadm-workshop: https://github.com/luxas/kubeadm-workshop
[kubernetes系列]HPA模块深度讲解: https://juejin.im/post/5b9dfc3df265da0ad947be85
Kubernetes自动缩扩容HPA算法小结: https://www.jianshu.com/p/504f49710f84
Metrics Implementations : https://github.com/kubernetes/metrics/blob/master/IMPLEMENTATIONS.md